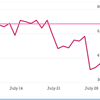
How to write 261 leads in a fraction of a second
If you're the kind of person who worries about your job when you read about…
September 17, 2013
If you're the kind of person who worries about your job when you read about…
On deadline, it's hard to visualize some data that would inform your readers more than…
To be honest, I hate politics -- especially on a national level. But local politics…
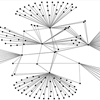
Data journalism, meet sensor journalism. You two should talk. What’s sensor journalism? I’ll get to…